Configuration Guide
The following guide will help you configure values.yaml file for a SuperSONIC deployment.
The full list of parameters can be found in the Configuration Reference.
You can find example values files in the SuperSONIC GitHub repository.
1. Select a Triton Inference Server Version
Official versions can be found at NVIDIA NGC.
You can also use custom-built Triton images.
Refer to the Nvidia Frameworks Support Matrix for compatibility information (CUDA versions, NVIDIA drivers, etc.).
Triton version must be specified in the triton.image parameter in the values file.
2. Configure Triton model repository
To learn about the structure of model repositories, refer to the NVIDIA Model Repository Guide.
Model repositories are specified in the
triton.argsparameter in the values file. The parameter contains the full command that launches a Triton server; you can specify one or multiple model repositories via the--model-repositoryflag.For example, the following command loads multiple CMS models hosted at CVMFS:
args:
  - |
   /opt/tritonserver/bin/tritonserver \
   --model-repository=/cvmfs/cms.cern.ch/el9_amd64_gcc12/cms/cmssw/CMSSW_14_1_0_pre7/external/el9_amd64_gcc12/data/RecoBTag/Combined/data/models/ \
   --model-repository=/cvmfs/cms.cern.ch/el9_amd64_gcc12/cms/cmssw/CMSSW_14_1_0_pre7/external/el9_amd64_gcc12/data/RecoTauTag/TrainingFiles/data/DeepTauIdSONIC/ \
   --model-repository=/cvmfs/cms.cern.ch/el9_amd64_gcc12/cms/cmssw/CMSSW_14_1_0_pre7/external/el9_amd64_gcc12/data/RecoMET/METPUSubtraction/data/models/ \
   --allow-gpu-metrics=true \
   --log-verbose=0 \
   --strict-model-config=false \
   --exit-timeout-secs=60
Make sure that the model repository paths exist. You can load models from a volume mounted to the Triton container. The following options for model repository mounting are provided via
triton.modelRepositoryparameter invalues.yaml:
Model repository options
# -- Model repository configuration
modelRepository:
  # Set to `true` to enable model repository mounting
  enabled: true

  # -- Model repository mount path (e.g /cvmfs/)
  mountPath: ""

  ## Model repository options:

  ## Option 1: mount an arbitrary PersistentVolumeClaim
  storageType: "pvc"
  pvc:
    claimName:

  ## -- OR --
  ## Option 2: mount CVMFS as PersistentVolumeClaim (CVMFS StorageClass must be installed at the cluster)
  storageType: "cvmfs-pvc"

  ## -- OR --
  ## Option 3: mount CVMFS via hostPath (CVMFS must be already mounted on the nodes)
  storageType: "cvmfs"

  ## -- OR --
  ## Option 4: mount an NFS storage volume
  storageType: "nfs"
  nfs:
    server:
    path:
1. Select Resources for Triton Pods
You can configure CPU, memory, and GPU resources for Triton pods via the
triton.resourcesparameter in the values file:
resources:
  limits:
    nvidia.com/gpu: 1
    cpu: 2
    memory: 16G
  requests:
    nvidia.com/gpu: 1
    cpu: 2
    memory: 16G
In addition, you can use
triton.nodeSelector,triton.tolerations,triton.annotations, andtriton.affinityto steer Triton pods to specific nodes. This is particularly useful for co-locating Triton pods with Envoy proxy to reduce latency.
4. Configure Envoy Proxy
By default, Envoy proxy is enabled and configured to provide per-request load balancing between Triton inference servers.
Once the SuperSONIC chart is installed, you need an address by which clients can connect to the Envoy proxy and send inference requests.
There are two options:
Ingress (recommended): Use an Ingress to expose the Envoy proxy to the outside world. You can configure the Ingress resource via the
envoy.ingressparameters in the values file:envoy: ingress: enabled: true hostName: "<ingress_url>" ingressClassName: "<ingress_class>" annotations: {}
In this case, the client connections should be established to
<ingress_url>:443and use SSL.For information on how to configure Ingress for your cluster, please refer to cluster documentation or contact cluster administrators.
LoadBalancer Service: This option allows to expose the Envoy proxy without using Ingress, but it may not be allowed at some Kubernetes clusters. To enable this, set the following parameters in the values file:
envoy.service.type: LoadBalancerenvoy.ingress.enabled: false
The LoadBalancer service can then be mapped to an external URL, depending on the settings of a given cluster. Please contact cluster administrators for more information.
In this case, the client connections should be established to
<load_balancer_url>:8001and NOT use SSL.
Some Envoy Proxy parameters, such as load balancing policy, rate limiting, and authentication,
can be cofigured directly in the values.yaml file as described in sections below.
Alternatively, you can provide an external Envoy configuration file to override the default configuration completely (the configuration file must be supplied as a ConfigMap):
envoy:
  external_config:
    load_from_configmap: true
    configmap_name: external-envoy-config
    configmap_key: envoy.yaml
5. (Optional) Configure Rate Limiting in Envoy Proxy
There are two types of rate limiting available in Envoy Proxy: listener-level, and prometheus-based.
Listener-level rate limiting allows to explicitly limit the number of client connections established to the Envoy proxy endpoint. It can be useful to prevent overloading the proxy with too many simultaneous client connections.
The listener-level rate limiting is implemented via “token bucket” algorithm. Each new connection consumes a token from the bucket, and the bucket is refilled at a constant rate.
Example configuration in
values.yaml:envoy: enabled: true rate_limiter: listener_level: # -- Enable rate limiter enabled: false # -- Maximum number of simultaneous connections to the Envoy Proxy. max_tokens: 5 # -- ``tokens_per_fill`` tokens are added to the "bucket" every ``fill_interval``, allowing new connections to be established. tokens_per_fill: 1 # -- For example, adding a new token every 12 seconds allows 5 new connections every minute. fill_interval: 12s
Prometheus-based rate limiting allows an additional layer of rate limiting based on a metric queried from a Prometheus server. This can be useful to dynamically control server load and stop accepting new connections when GPUs are saturated.
This rate limiter can be enabled via the
envoy.rate_limiter.prometheus_basedparameter in the values file.At the moment, this functionality is configured to only reject
RepositoryIndexrequests to Triton servers, and it ignores any other requests in order not to slow down the inferences.The metric and threshold for the Prometheus-based rate limiter are the same as those used for the autoscaler (see Prometheus Configuration).
6. (Optional) Configure Authentication in Envoy Proxy
At the moment, the only supported authentication method is JWT. Example configuration for IceCube:
envoy:
  auth:
    enabled: true
    jwt_issuer: https://keycloak.icecube.wisc.edu/auth/realms/IceCube
    jwt_remote_jwks_uri: https://keycloak.icecube.wisc.edu/auth/realms/IceCube/protocol/openid-connect/certs
    audiences: [icecube]
    url: keycloak.icecube.wisc.edu
    port: 443
7. Deploy a Prometheus Server or Connect to an Existing One
Prometheus is needed to scrape metrics for monitoring, as well as for the rate limiter and autoscaler.
Option 1 (recommended): Deploy a new Prometheus server.
This will allow to configure a shorter scraping interval, resulting in a more responsive rate limiter and autoscaler. Prometheus server typically uses only a small amount of resources and does not require special permissions for installation.
This option installs Prometheus as a subchart, the default values for it are set to reasonable values. You can further customize the Prometheus installation by passing parameters from official Prometheus values.yaml file under the
prometheussection of the SuperSONIC values file:prometheus: enabled: true server: ingress: enabled: true ingressClassName: "<ingress_class>" hosts: - "<prometheus_url>" tls: - hosts: - "<prometheus_url>"
The parameters you will most likely need to configure in your values file are related to Ingress for web access to Prometheus UI.
Warning
This option requires permissions to list pods in the installation namespace. Permission validation is performed automatically: if you don’t have the necessary permissions, an error message will be printed when running
helm installcommand.Option 2: Connect to an existing Prometheus server.
If you don’t have enough permissions to install a new Prometheus server, you can connect to an existing one. If
prometheus.external.enabledis set totrue, all parameters in theprometheussection, except the ones underprometheus.external, are ignored.prometheus: external: enabled: true scheme: "<https or http>" url: "<prometheus_url>" port: <prometheus_port>
8. (Optional) Configure Metrics for Scaling and Rate Limiting
Both the rate limiter and the autoscaler are currently configured to use the same Prometheus metric and threshold.
They are defined in the serverLoadMetric and serverLoadThreshold parameters at the root level of the values file.
The default metric is the inference queue time at the Triton servers, as defined in
here.
When the metric value exceeds the threshold, the following happens:
Autoscaler scales up the number of Triton servers if possible.
Envoy proxy rejects new
RepositoryIndexrequests.
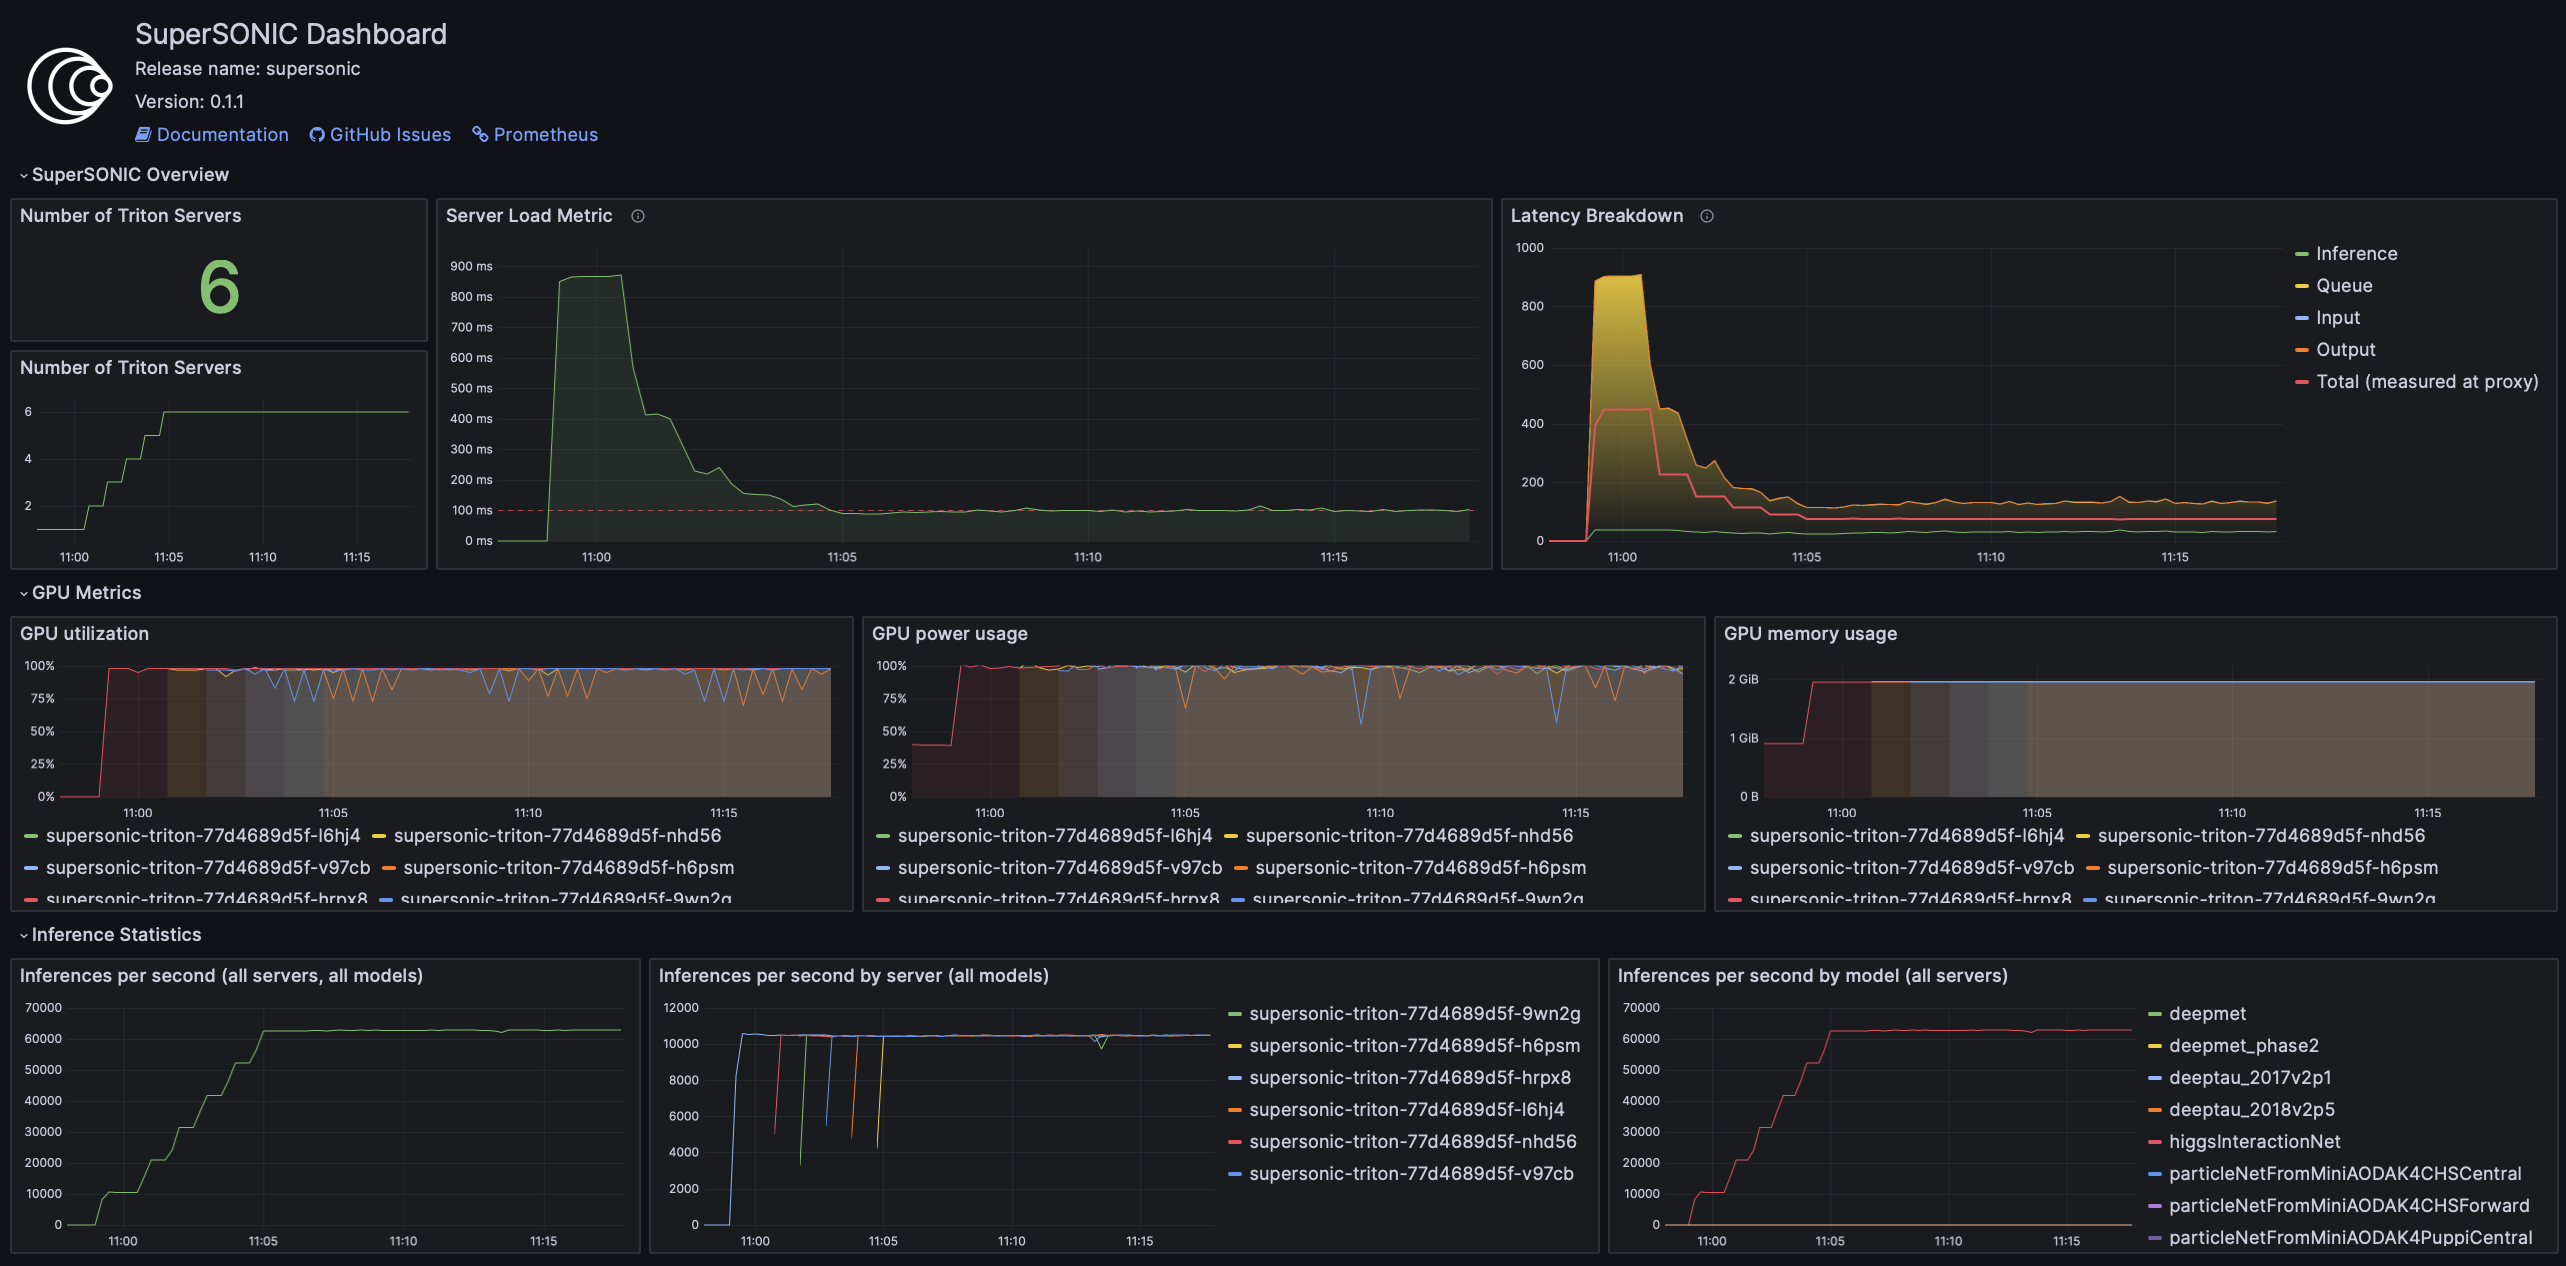
The pre-configured Grafana dashboard contains a graph of this metric, entitled “Server Load Metric”.
The Prometheus query for the graph is automatically inferred from the value of serverLoadMetric parameter.
The graph also displays the threshold value defined in serverLoadThreshold parameter.
9. (Optional) Deploy Grafana Dashboard
Grafana is used to visualize metrics collected by Prometheus. We provide a pre-configured Grafana dashboard which includes many useful metrics, including latency breakdown, GPU utilization, and more.
If you have a Grafana instance already installed, you can deploy SuperSONIC dashboars by copying one of the JSON files from the SuperSONIC repository.
If you don’t have a Grafana instance already installed, you can deploy one as a subchart of SuperSONIC, in which case the dashboard will be automatically deployed.
You can further customize the Grafana installation by passing parameters from
official Grafana values.yaml file
under the grafana section of the SuperSONIC values file:
grafana:
  enabled: true
  ingress:
    enabled: true
    ingressClassName: "<ingress_class>"
    hosts:
       - "<grafana_url>"
    tls:
      - hosts:
          - "<grafana_url>"
The values you will most likely need to configure in your values file are related to Grafana Ingress for web access, and datasources to connect to Prometheus,
10. Enable KEDA Autoscaler
Autoscaling is implemented via KEDA (Kubernetes Event-Driven Autoscaler) and
can be enabled via the keda.enabled parameter in the values file.
Warning
Deploying KEDA autoscaler requires KEDA CustomResourceDefinitions to be installed in the cluster. Please contact cluster administrators if this step of installation fails.
The parameters keda.minReplicaCount and keda.maxReplicaCount define the range in which
the number of Triton servers can scale.
Additional optional parameters can control how quickly the autoscaler reacts to changes in the Prometheus metric:
keda:
  enabled: true

  minReplicaCount: 1
  maxReplicaCount: 10

  scaleUp:
    stabilizationWindowSeconds: 120
    periodSeconds: 30
    stepsize: 1
  scaleDown:
    stabilizationWindowSeconds: 120
    periodSeconds: 30
    stepsize: 1
11. (Optional) Configure Metrics Collector for Running perf_analyzer
To collect Prometheus metrics when using perf_analyzer for testing,
a Metrics Collector can be deployed to format Prometheus metrics properly.
The Metrics Collector is installed as a subchart with most of the default
values pre-configured. To enable the Metrics Collector, set the
metricsCollector.enabled parameter to true in your values file
and configure ingress settings if needed as shown below:
metricsCollector:
  enabled: true
  ingress:
    enabled: true
    hostName: "<metrics_collector_url>"
    ingressClassName: "<ingress_class>"
    annotations: {}
Running with perf_analyzer is then done with:
perf_analyzer -m <model_name> -u <envoy_engress> -i grpc \
    --collect-metrics --metrics-url <metrics_collector_url>/metrics \
    --verbose-csv -f <out_csv_file_name>.csv
If ingress is not desired, port-forward the metrics collector service and call
--metrics-url localhost:8003/metrics to access the metrics.
12. (Optional) Configure Advanced Monitoring
Refer to the advanced monitoring guide.